Oil & Gas Facility Planning & Maintenance Workflow
My Role
UX/UI Designer | Workflow Strategist
Platform
Desktop Web Application (Internal Tool)
Project Scope
- Facility Planning
- Maintenance Scheduling
- Workflow Optimization
- UX/UI Design
- Reporting
Overview
This project combined two critical workflows into one cohesive experience for an oil and gas company operating multiple production sites in the Southwest. The aim was to streamline how facilities are designed and how maintenance is planned, scheduled, and tracked—while aligning the workflows of Facility Engineers and Facility Maintenance Team Members.
The project was initiated in response to repeated delays between new facility construction and the implementation of timely maintenance schedules. The disconnect was affecting asset longevity, increasing costs, and reducing confidence between operations, engineering, and finance teams.
Our solution involved creating an integrated platform for facility planning, real-time cost tracking, and lifecycle-based maintenance scheduling. The result was a visual-first tool tailored to the actual workflow and communication habits of these critical users.
Problem
Before the redesign, facility planning and maintenance operated with separate tools, workflows, and data sources. Engineers used CAD and spreadsheets to plan builds, while maintenance teams relied on CMMS platforms and manual processes for inspections and repairs.
Although systems existed to track construction, commissioning, and upkeep, they weren’t connected. Critical data was scattered across project tools, engineering files, and maintenance logs—making it hard to align on a shared, real-time view.
As a result:
Engineering lacked visibility into asset health during planning.
Maintenance teams often received incomplete info on new equipment.
Asset data was duplicated or outdated, impacting reliability.
This led to missed maintenance, budget overruns, and poor forecasting—slowing decisions, increasing operational risk, and limiting scalability.
.png)
User Story: Facility Engineer
“As a Facility Engineer, I want to build a new oil and gas facility using a custom map-based UI. I want to visualize where to place key components like storage tanks and compressors, track the total cost vs. budget, and export my plan as a data table for Accounting.”
We created a visual interface that allows engineers to:
- Select a geographic area
- Drag and place building blocks: tanks, pipes, compressors, pads, etc.
- See cost updates in real time
- Export the bill of materials and layout to downstream teams
Our team's largest design constraint was time. We had 40 hours to complete all design phases.
To begin, the client provided links to the user research conducted by a previously hired UX/UI team.
Due to time constraints and after research of provided documents, we decided to use the existing user research and limit our design phases to Secondary Research, Sketches, Style Guide and Hi-fidelity Prototypes.
User Story: Facility Maintenance Team Member
“As a member of the Facility Maintenance Team, I want to access a clear calendar of upcoming maintenance, filter tasks by type (PM, PdM, CM), and update work orders in real-time, so I can keep assets running and avoid unplanned downtime.”
We built a dedicated dashboard that included:
- A scheduling calendar view
- Asset filtering by location, status, and risk level
- Task-based checklists with documentation uploads
- A technician portal with user-friendly data entry
UX Process Overview
We followed a user-centered design process that included stakeholder alignment, contextual inquiry, journey mapping, iterative prototyping, and usability testing.
Using Figma and Miro, we mapped current-state workflows and pain points, developed wireframes, and tested prototypes in multiple rounds with end users.
Discovery & Research
Our discovery phase combined stakeholder workshops, field observations, and semi-structured interviews across two production sites. We interviewed:
- 5 Facility Engineers
- 6 Maintenance Schedulers
- 3 Field Technicians
- 2 Cost Controllers
- 1 Compliance Officer
We synthesized our findings into personas, pain points, and current-state journey maps to ground the problem space and align cross-functional teams.
Key insights included:
- Engineers wanted to simulate layout decisions without waiting on CAD or GIS updates
- Maintenance teams lacked early documentation for new builds, creating avoidable delays
- Budget impacts weren’t clearly understood at the planning stage
- Budget impacts weren’t clearly understood at the planning stage
- All teams were open to digital transformation but wary of introducing complexity
These insights helped shape actionable design goals and informed the layout of both planning and maintenance modules.
Design Solutions
Facility Planning Module
- Built with a modular map interface using Mapbox
- Drag-and-drop components (tanks, roads, pads, compressors)
- Real-time cost tracking with visual budget alerts
- Data table auto-generated based on design
Maintenance Management Module
- Shared calendar with PM, PdM, CM filters
- Work order generator tied to equipment specs and history
- Upload portal for manuals, safety sheets, and inspection photos
- Field mode for mobile-friendly views and offline sync
Reporting & Handoff
- Export features to send data to Accounting and QA
- Custom dashboards for asset lifecycle tracking
- Integrated KPI widgets: MTBF, backlog, budget variance
Usability Testing
We ran multiple usability testing rounds, simulating real-world tasks such as:
- Designing a multi-well facility within a set budget
- Scheduling inspections for at-risk equipment
- Exporting compliance reports for review
Each round led to refinements in layout, terminology, and flow—for example, simplifying filters in the maintenance calendar after observing technician hesitation during task selection.
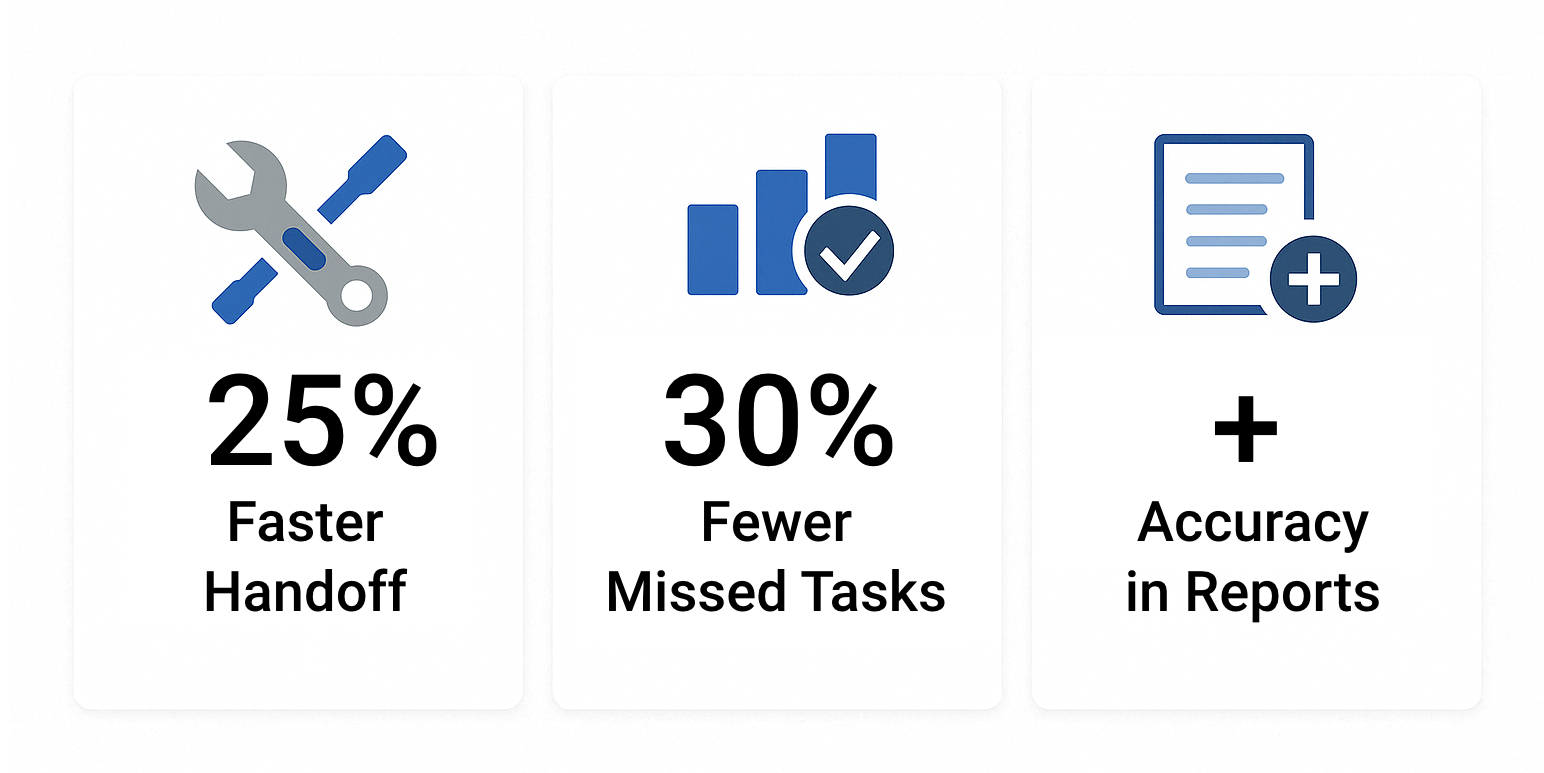
Results
- 25% reduction in planning-to-execution time
- 30% fewer missed PM tasks due to clearer asset tracking
- Positive feedback from accounting teams for export accuracy
- Stakeholder buy-in for next phase: mobile technician app
Team & Tools
Team
- UX/UI Designer (me)
- 1 Product Owner
- 2 Backend Developers
- 1 Facility Engineer (SME)
- 1 Reliability Analyst
Tools
- Figma
- Mapbox
- Jira
- Confluence
- Google Sheets
- FigJam
- Photoshop
- Illustrator
- Teams
Reflection
This project reinforced the importance of designing for handoffs and not just interfaces. By addressing both the facility planning and maintenance scheduling gaps, we bridged an operational divide that had existed for years.
The success of this case came not from reinventing the wheel, but from creating the shared language and tools to make planning, tracking, and execution feel seamless—regardless of which team a user belonged to.
Would I do it again? Absolutely. In phase two, we’ll be exploring live asset tracking, sensor integrations, and mobile workflows for on-site techs.
Note: Click here to view the prototype.
